POWERSENSE
PowerSense — Smart Campus Energy Monitoring System
OVERVIEW
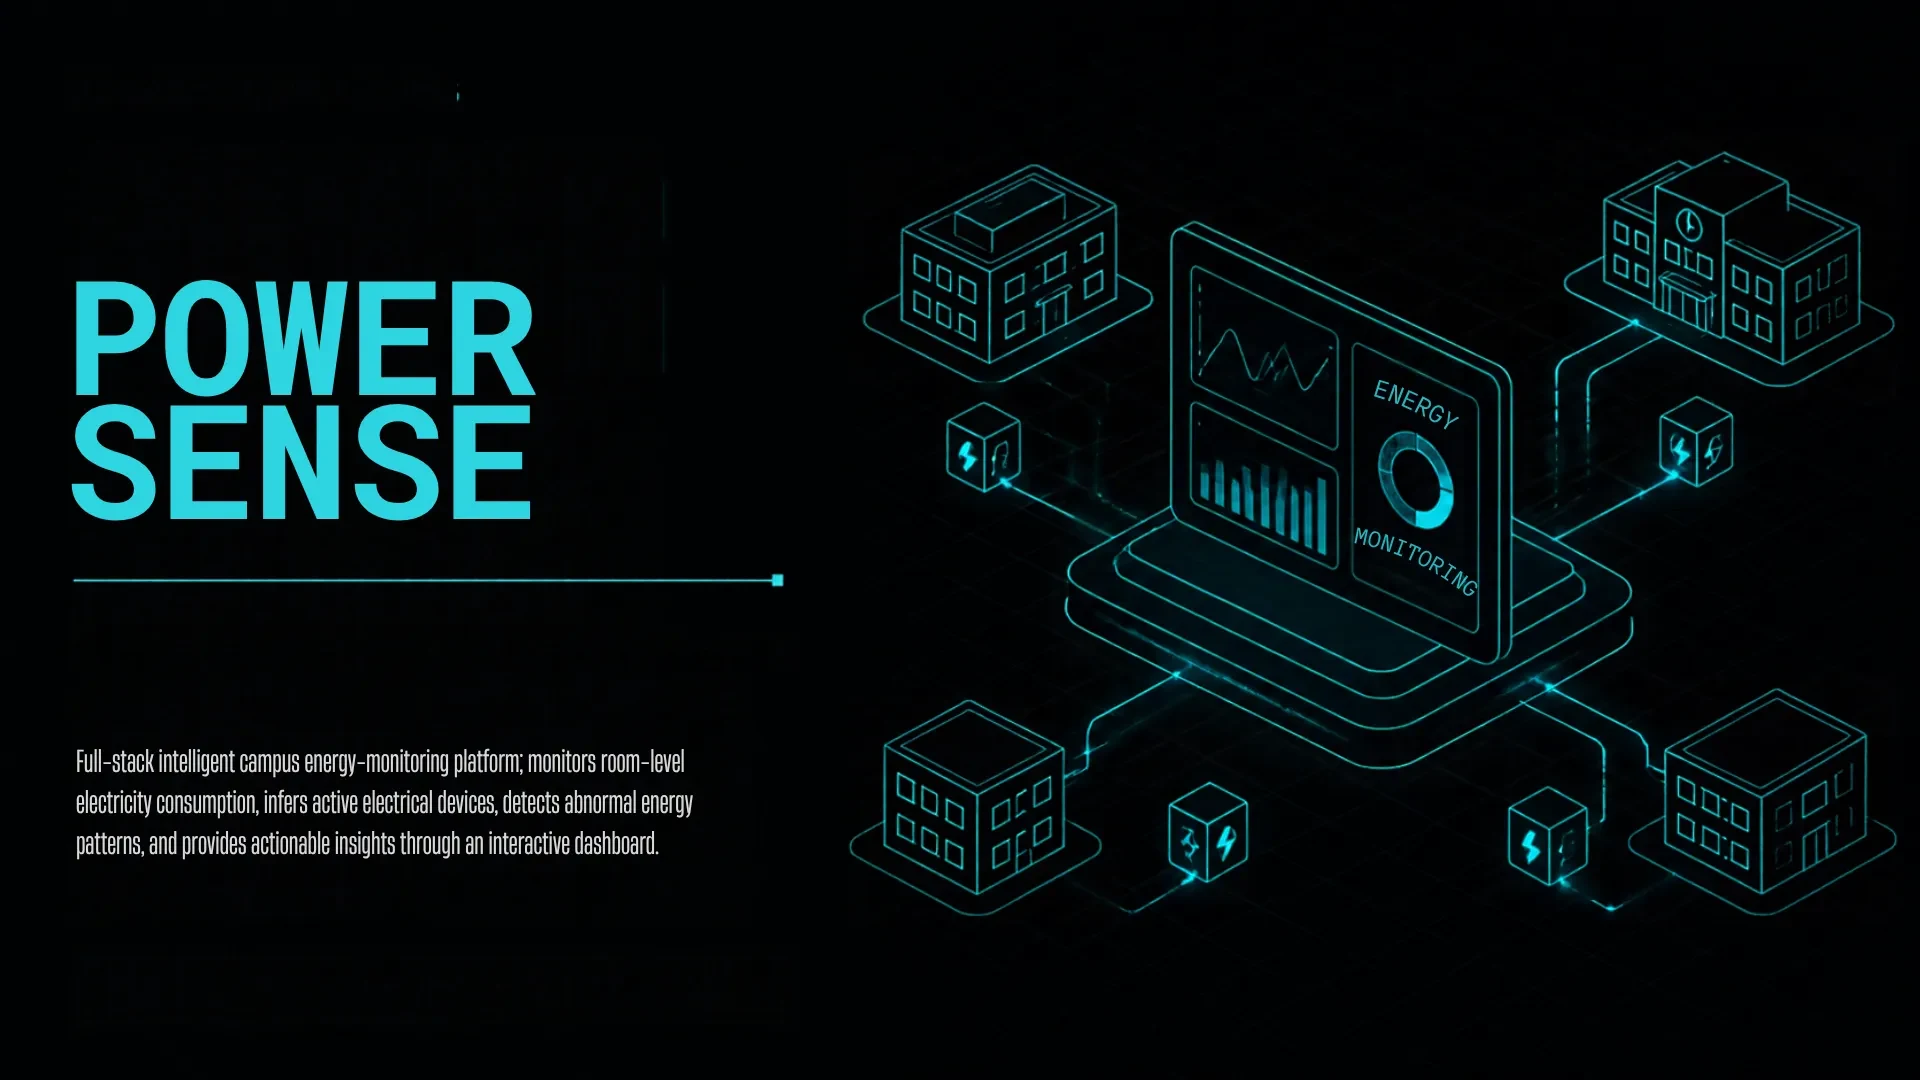
PowerSense is a full-stack intelligent campus energy-monitoring platform that monitors room-level electricity consumption, infers active electrical devices, detects abnormal energy patterns and provides actionable insights through an interactive dashboard.
PROBLEM STATEMENT
Institutional campuses waste significant energy: devices are left on after working hours, there is no room-level consumption visibility, and there is no automated anomaly detection, alerting or centralised energy analytics.
OBJECTIVES
- ▸ Monitor room-level electricity consumption.
- ▸ Infer active electrical devices.
- ▸ Detect abnormal energy patterns.
- ▸ Provide actionable insights through an interactive dashboard.
PROPOSED SOLUTION
A full-stack web application that reads live wattage per room through Socket.io, infers active devices with a subset-sum matching algorithm, flags anomalies with a machine-learning model, raises after-hours alerts, and calculates the energy, cost and CO₂ impact of the waste.
FEATURES
- ▸ Real-time energy monitoring
- ▸ Device load inference
- ▸ Anomaly detection
- ▸ After-hours energy monitoring
- ▸ Incident alerts
- ▸ Energy analytics
- ▸ Financial impact estimation
- ▸ CO₂ impact estimation
- ▸ Campus infrastructure visualization
TECHNOLOGY STACK
SYSTEM ARCHITECTURE
Smart-meter readings reach an Express.js / Node.js REST API, are stored in MongoDB and pushed live to a React + Vite dashboard over Socket.io. A load-inference engine (subset-sum) and a Python Flask service (scikit-learn Isolation Forest) handle device matching and anomaly detection.
WORKFLOW
- ▸ A smart meter sends real-time wattage data to the REST API.
- ▸ The system matches the wattage against the device database using subset-sum.
- ▸ The ML model analyses historical patterns to detect an anomaly.
- ▸ The engine cross-checks room data and the configured working hours.
- ▸ An alert is triggered and pushed to the admin dashboard via Socket.io.
- ▸ Impact Forensics calculates the waste in kWh, ₹ and CO₂.
- ▸ The administrator resolves the incident from the Anomalies page.
SCREENSHOTS
CHALLENGES
- ▸ Getting live data to show in real time. Solved by pushing meter readings to the dashboard instantly with Socket.io.
FUTURE IMPROVEMENTS
- ▸ Connect real smart meters.
- ▸ Send alerts by SMS.